Financial Highlights
Recent & upcoming events
See all events
Navigation
- Previous
-
Financial Highlights
-
Stock Information
-
Contact us
-
Debt Information
-
Corporate Governance
-
Events
-
Reports
-
Financial Highlights
-
Stock Information
-
Contact us
-
Debt Information
-
Corporate Governance
-
Events
-
Reports
-
Financial Highlights
-
Stock Information
-
Contact us
-
Debt Information
-
Corporate Governance
-
Events
Financial Highlights
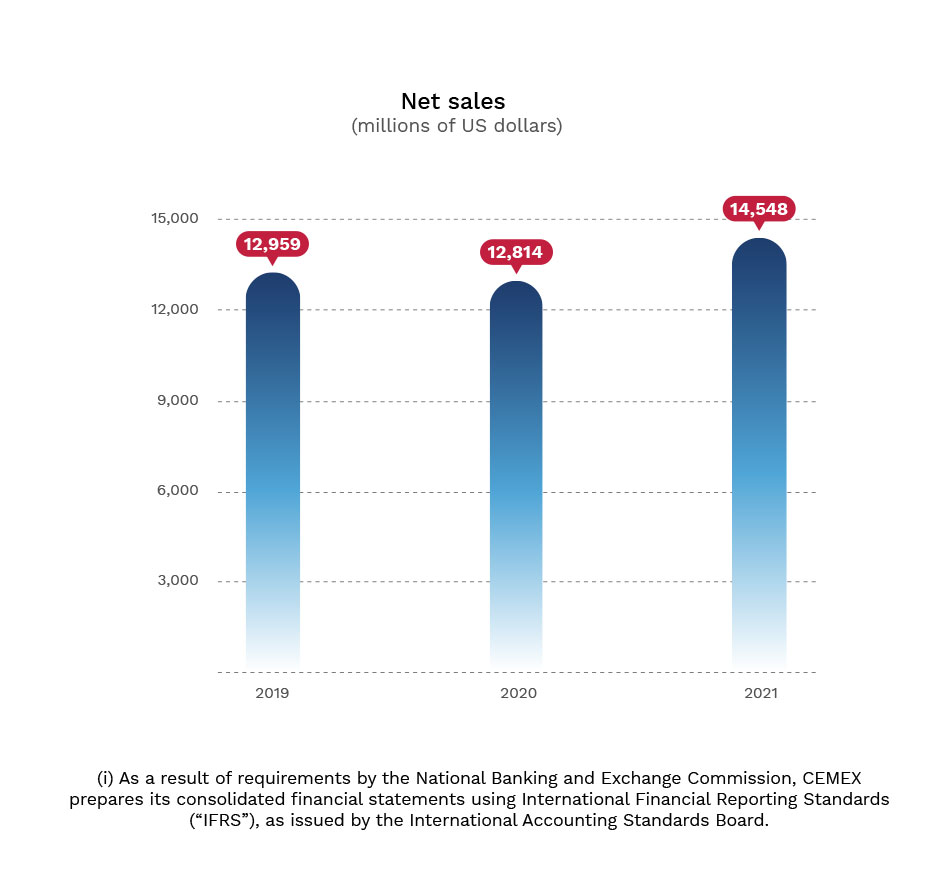
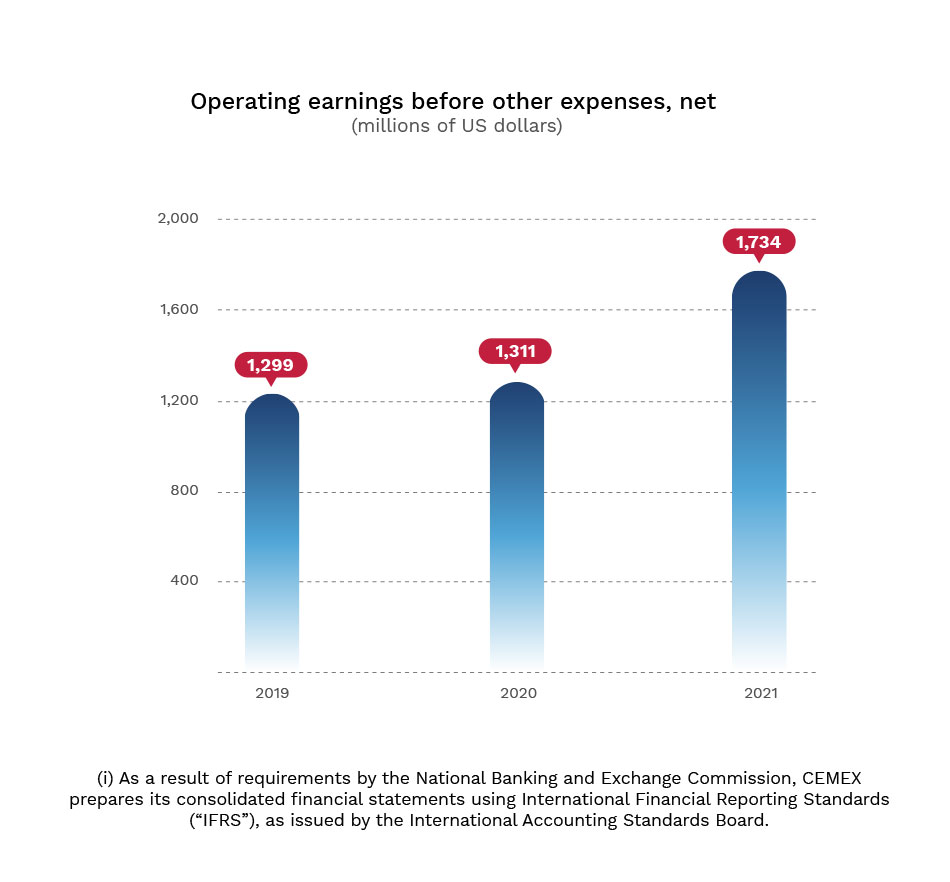
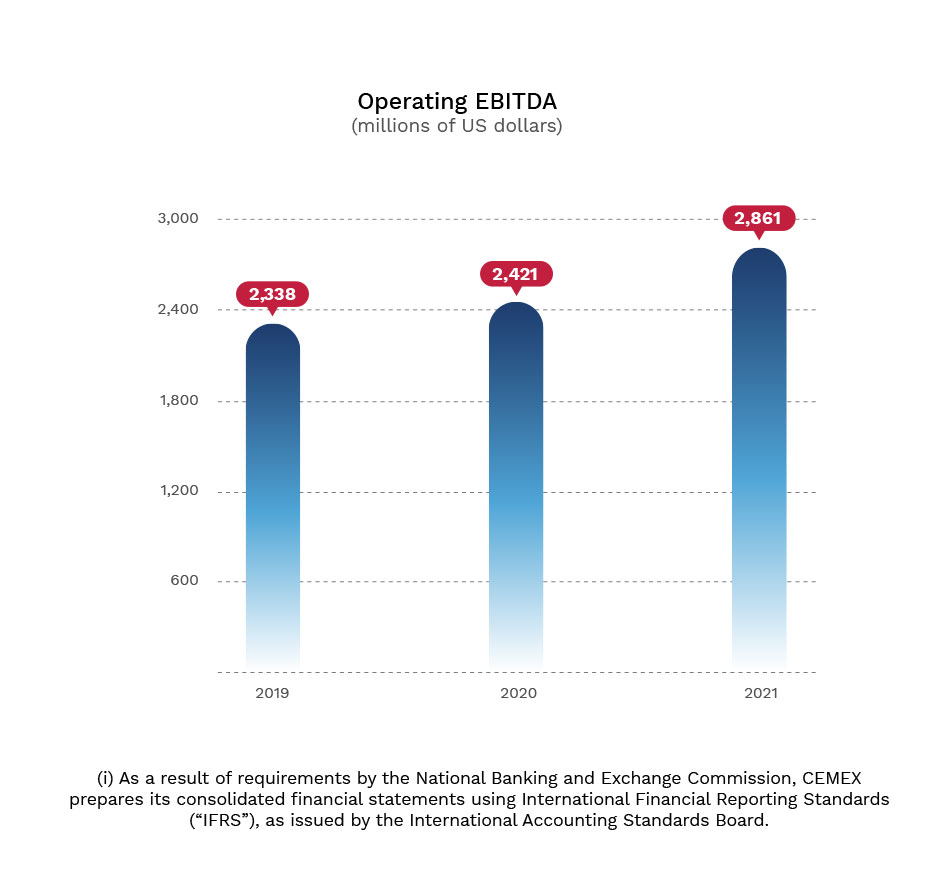
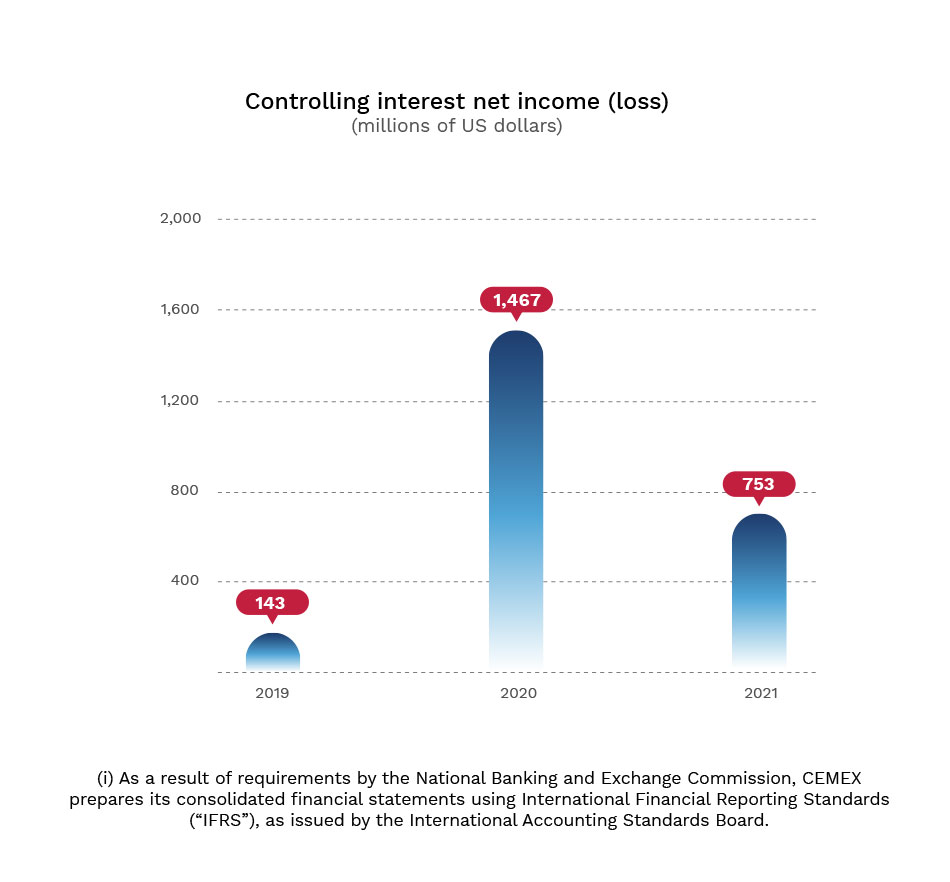
In millions of US dollars1, except earnings (loss) per ADS
| 2021 | 2020 | % Variation | |
|---|---|---|---|
| Net Sales | 14,548 | 12,814 | 13.5% |
| Operating earnings before other expenses, net | 1,734 | 1,311 | 32.3% |
| Operating EBITDA | 2,861 | 2,421 | 18.2% |
| Controlling interest net income (loss) | 753 | (1,467) | -151.3% |
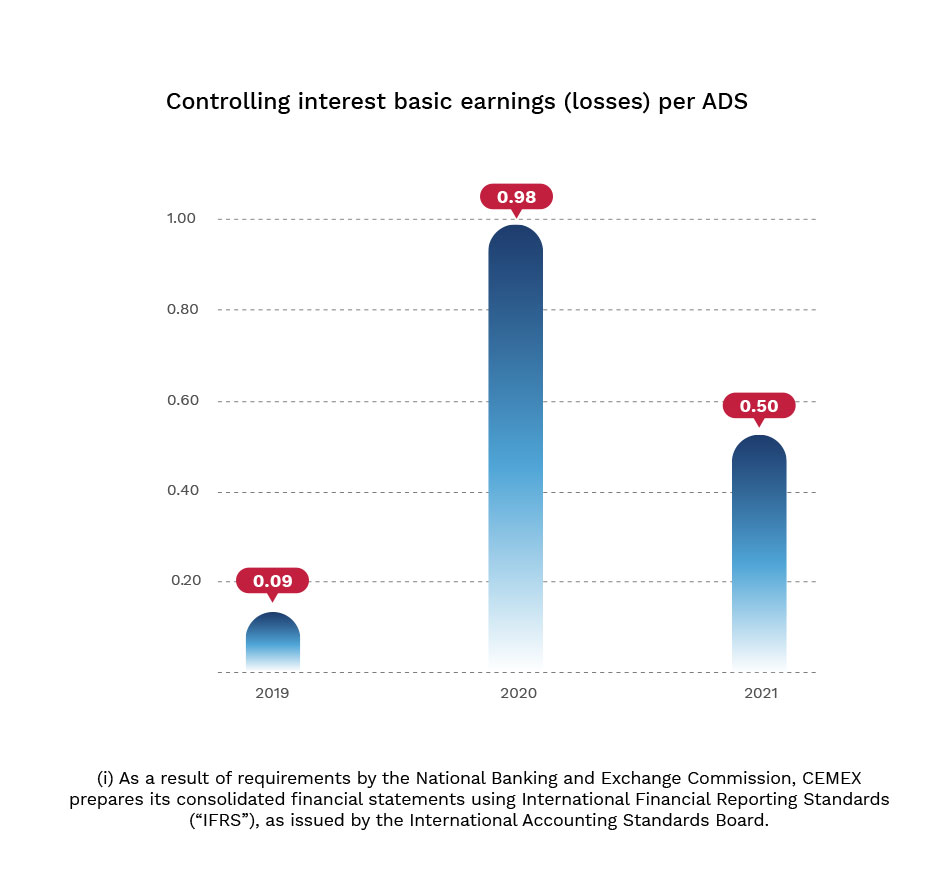
| Controlling interest basic earnings (loss) per ADS2 | 0.50 | (0.98) | -151.0% |
| Controlling interest basic earnings (loss) per ADS2 from continuing operations | 0.51 | (0.91) | |
| Controlling interest basic earnings (loss) per ADS2 from discontinued operations | (0.01) | (0.07) | |
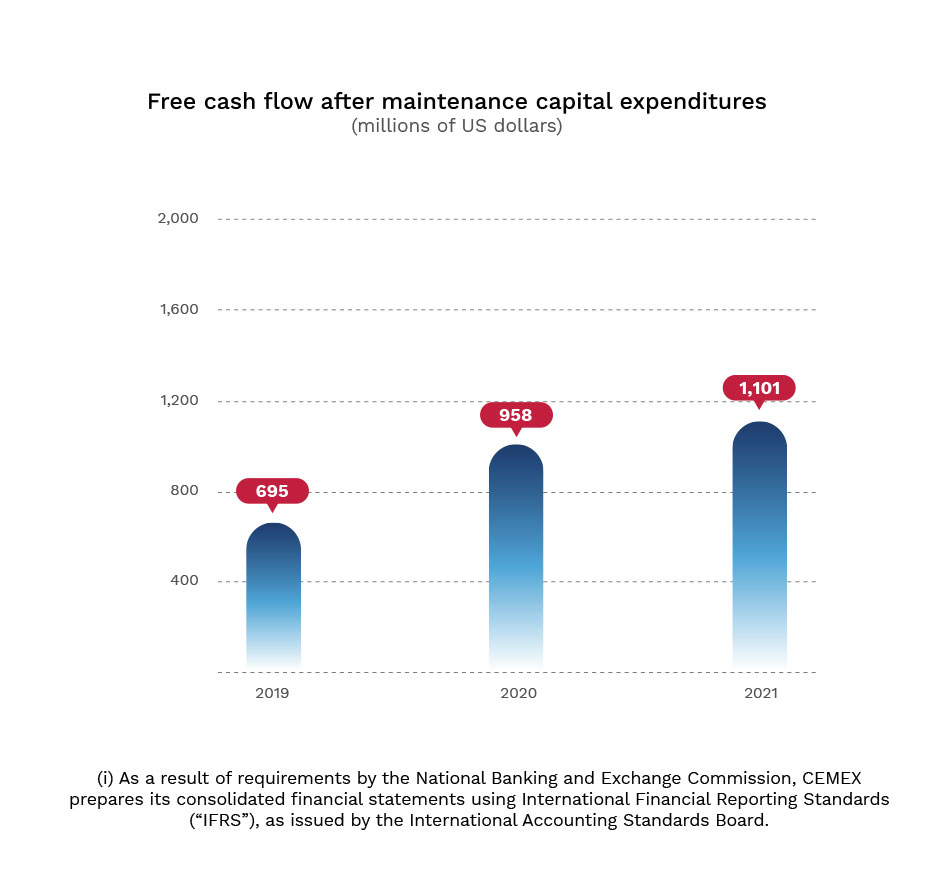
| Free cash flow after maintenance capital expenditures | 1,101 | 958 | 14.9% |
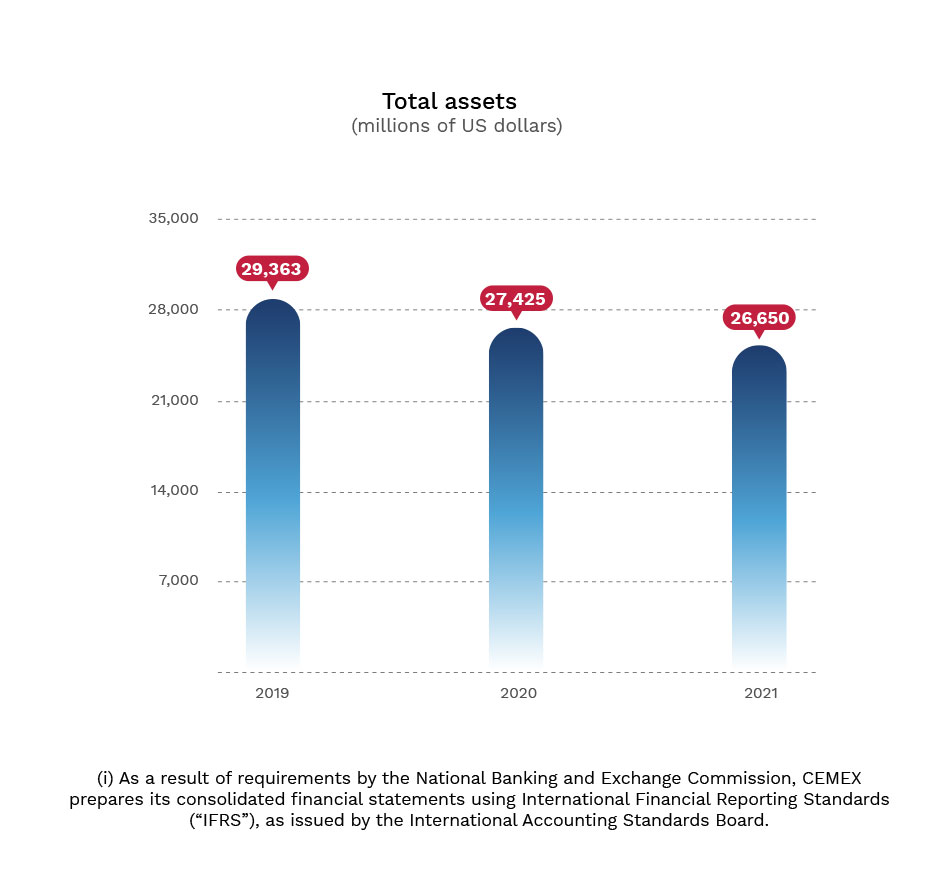
| Total assets | 26,650 | 27,425 | -2.8% |
| Total debt plus other financial obligations | 9,157 | 11,185 | -18.1% |
| Total controlling stockholders' equity | 10,271 | 8,952 | 14.7% |
As of December 31, 2021
1 Under IFRS, CEMEX translates the financial statements of foreign subsidiaries using exchange rates at the reporting date for the balance sheet and the exchange rates at the end of each month for the income statement.
2 Based on an average of 1,495 and 1,498 million American Depositary Shares (ADSs) for 2021 and 2020, respectively.


-
Key Company FAQs
If you have any questions regarding investing with CEMEX, this is the place.
Company FAQs -
Glossary
An alphabetic list of terms and definitions specific to financial and industry topics.
Glossary
